
Tensorflow: A Conceptual Introduction
An illustrative introduction to the core concepts behind Tensorflow.
Table of Contents
What is TensorFlow
TensorFlow (TF) is an opensource numerical computation framework that provides abstractions of regularly used Machine Learning (ML) and Deep Learning (DL) tools, along with the capability to build new models, optimizers, loss functions etc. As opposed to the myriad of other ML/DL libraries, TensorFlow provides the critical balance between the flexibility needed for research, and the scalability and efficiency needed to deploy application in production.
The TF framework uses two fundamental concepts:
- The DataFlow Programming Paradigm
- Encapsulation of Data as Tensors
The DataFlow Programming Paradigm
The kind of programming paradigm that most programmers are exposed to is Imperative Programming. Here the code is a sequence of commands, where the control flows through the code in an ordered manner to generate the desired output. The primary focus of an imperative program is concerning what statement needs to be executed next, rather than what data is required for said execution. More succinctly, imperative programming is control flow rather than data flow.
In DataFlow programming, the code is a collection of definitions of operations that need to be performed. An operation can be something as simple as addition of two numbers, to performing a complicated optimization routine. Operations can be dependent on some input data, or on the output of other operations (the stand-alone case is uninteresting). The primary requirement for evaluation of an operations is the availability of all its inputs, making it reactive to data, hence the moniker: Data Flow.
DataFlow and TensorFlow
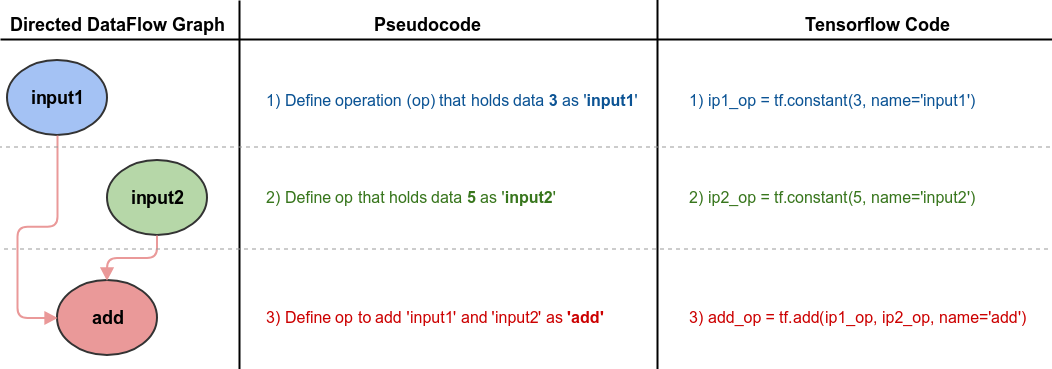
The code of a dataflow program is generally visualized as a directed graph whose nodes are operations, and the incoming edges signify the data that flows between the operations. Hence the first step in any TF application is to build a DataFlow graph. For example, to add two numbers in TF, we build the graph by defining operations as graph nodes, and dependencies to other operations as edges. The three lines of TF code in the figure below does exactly that. Line 1 and 2 defines operations that hold the data resulting in the creation of the blue and green node. Line 3 defines the add operation, and since it uses ip1_op and ip2_op as arguments to the op, the red node along with the two red edges get created. One important thing to note is that, at this point the actual evaluation of 3+5 has not yet taken place, only the graph is built.
Sub-graphs
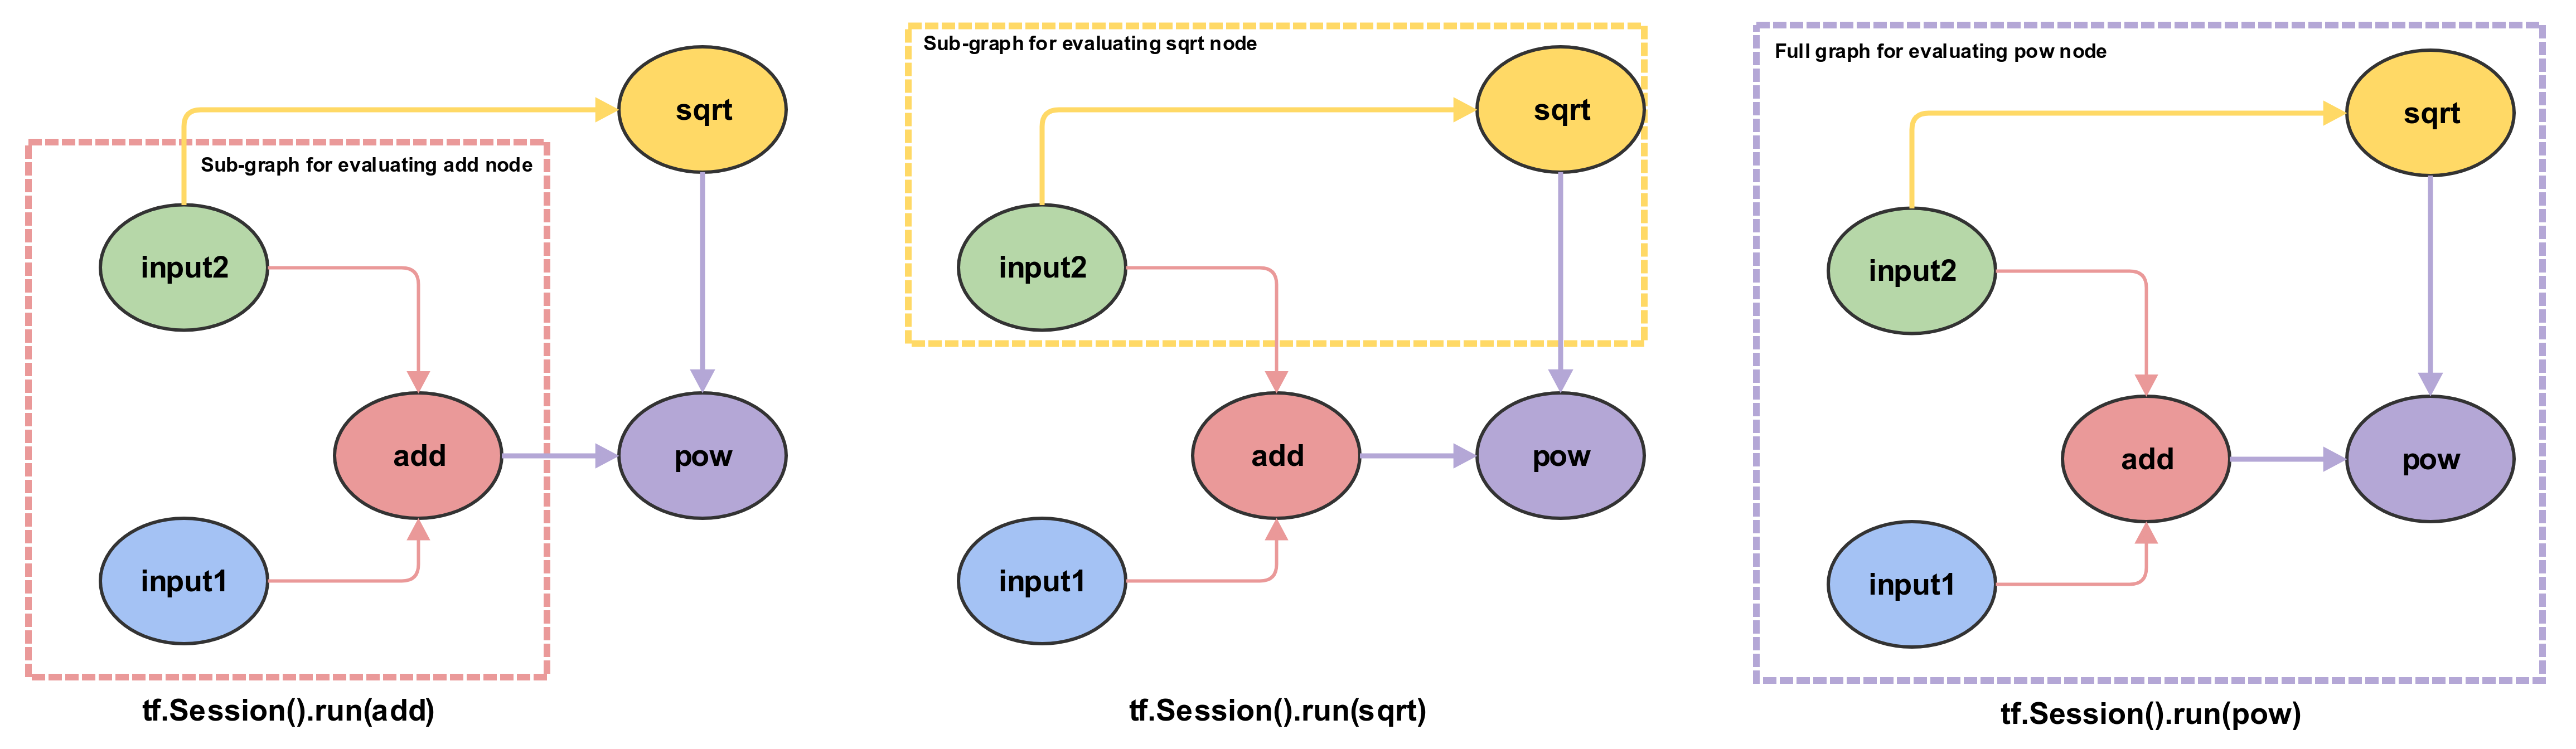
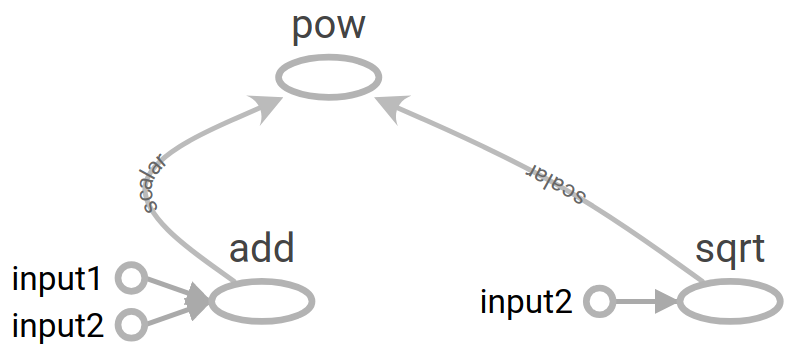
In the dataflow programming paradigm, the concept of execution is seen as the evaluation of a directed graph when data flows through it. In TF, rather than executing a graph directly, we evaluate nodes. Since nodes have dependencies we end up evaluating only the sub-graph induced by these dependencies. As depicted in the figure below, the evaluation of the add node would would result in the data held in input1 and input2 nodes (here3 and 5) to flows to the add node. Since all the dependencies of the add node is now met, it then proceeds to evaluated itself, ie compute 3+5=8. Thus, in TF parlance, we say that the node add evaluates to 8. Similarly, when we evaluate the pow node, the dependant nodes add and sqrt is evaluated first, and then the pow node has the necessary data to evaluate itself.
Graph Evaluation
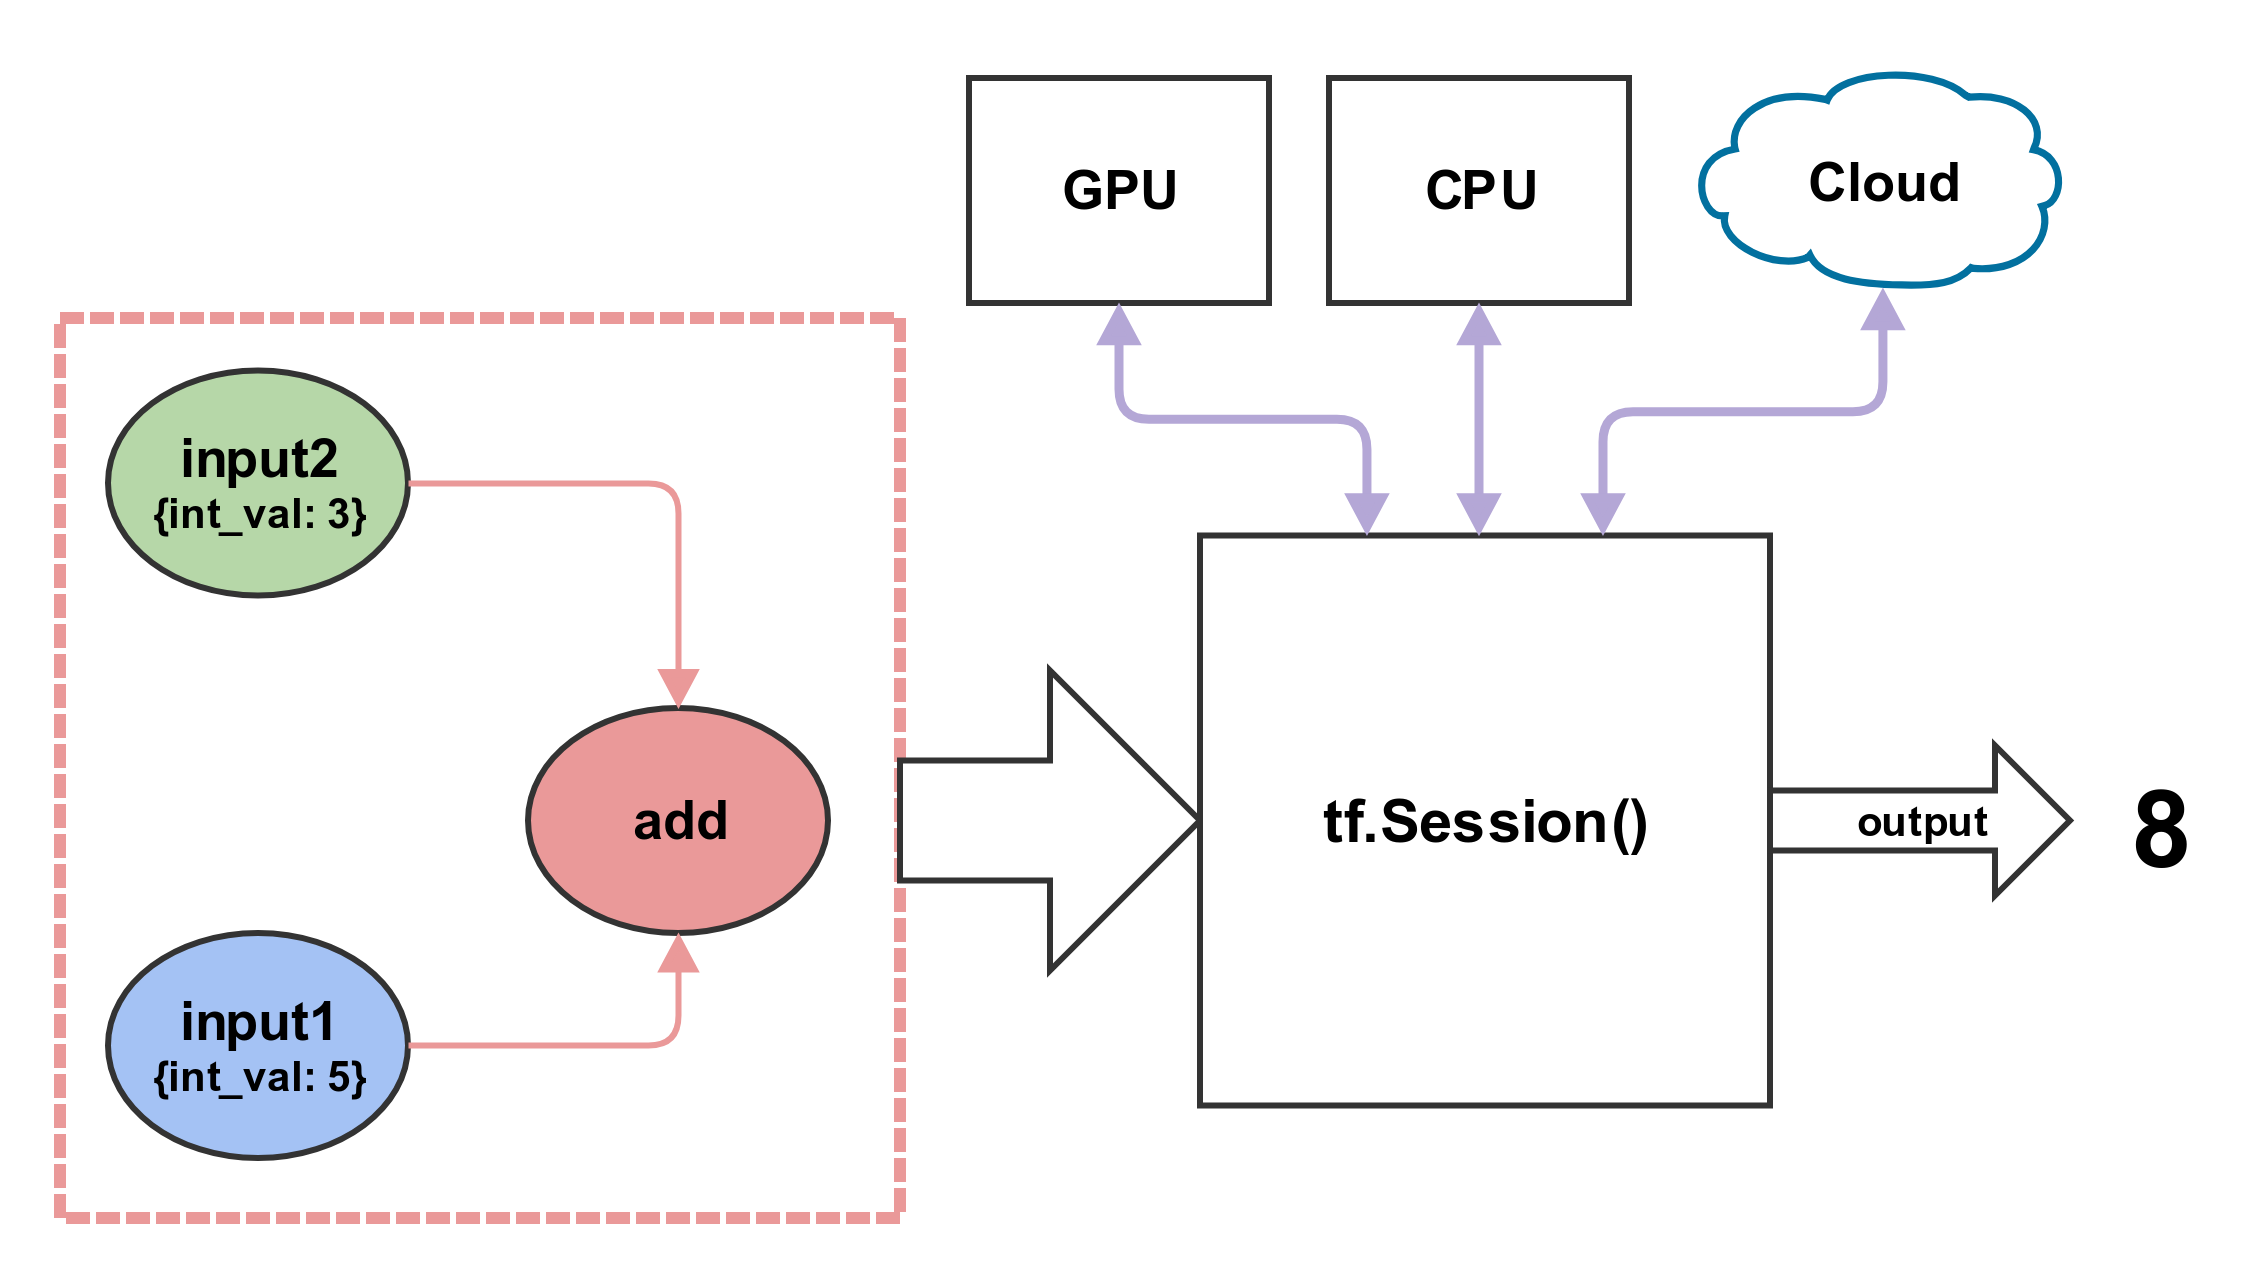
In order to evaluate the nodes we use a tf.Session object. A session object acts as a container to contextualize the execution environment of a graph. One can think of session as an execution engine for the DataFlow graph - the node to be evaluated is sent to the session, it evaluates the induced sub-graph, and spits out an output. The actual physical location where the code is executed, ie CPUs, GPUs, TPUs, distributed cloud etc., is managed by the session object. That said, we have the flexibility to specify where we want certain operations to be executed. We’ll introduce more advanced methods of graph execution in later posts.
Why use DataFlow paradigm?
Many ML/DL models (Neural Networks, Grahpical models etc.) are represented as graphs for visualizing their theoretical definitions. Using graphs as a computational model for such models is a natural extension to make. Moreover, using graphs to model ML/DL problems have many computational advantages as well. For example, computation of an operation (node) only requires the execution of a sub-graph that is connected to the operation, thereby saving compute time. This also allows the computation to be broken into smaller fragments which facilitate distributed computing (spread the computation to different CPUs, GPUs, TPUs etc.).
Most ML/DL applications has an optimizer component which quite often uses gradient-based methods to minimize the loss function. Traditionally, the gradient of the loss function is evaluated by hand, and provided to the optimizer - which is tedious and sometimes a hard problem in itself. By representing the model as a graphs we can facilitate the use of auto-differentiation to eliminate the manual step of deriving and implementing a gradient function.
Encapsulation of Data as Tensors
A tensor is a mathematical object represented as a multidimensional array of numbers. Based on the context it can mean many things. For example, a tensor can be a linear transformation between vectors, scalars, and even other tensors. More on the mathematical aspects of tensors, here and here.
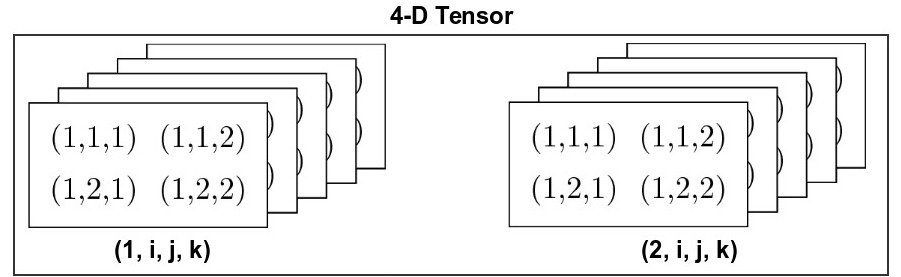
For the purposes of TensorFlow, think of a tensor as storage unit capable of storing objects in a structured manner. The following diagram illustrates the structure and indexing of tensors, as they grow in dimension.
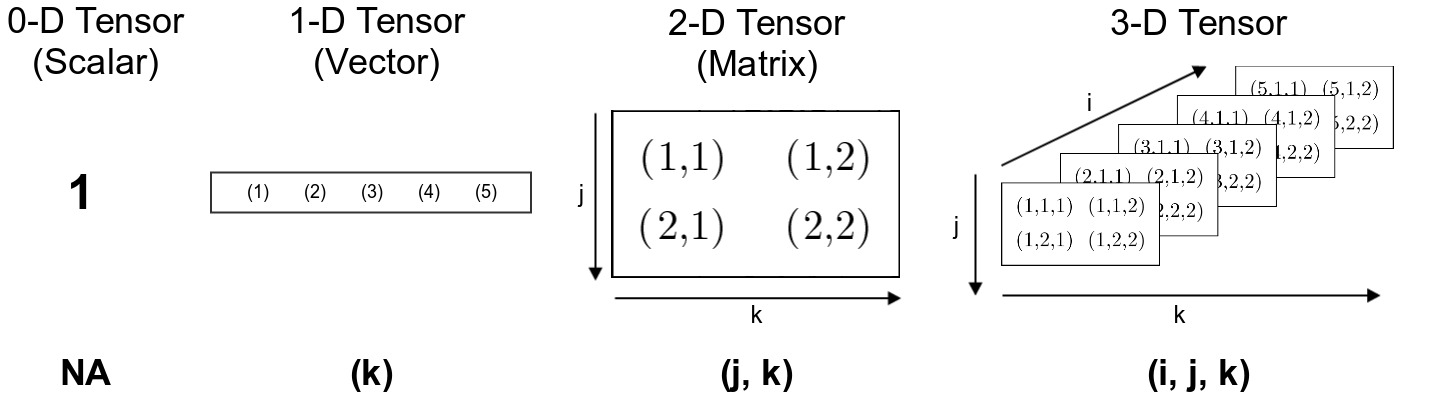
In the above diagram, a cell is denoted with the indexing scheme used to access the stored value. When the dimensions grow, index for the higher dimension is tacked onto the left side. For example, an element in a 2-D tensor (matrix) is indexed as (row, column), whereas in a 3-D tensor, it is (depth, row, column).
It’s hard to visualize the structure of tensors larger than three dimensions. One trick is to think of higher dimensions as a container to store an array of lower dimensional tensors in an structured (indexed) manner. For example, a 4-D tensor is an array of 3-D tensors.
Similarly a 5-D tensor is an array of 4-D tensors.
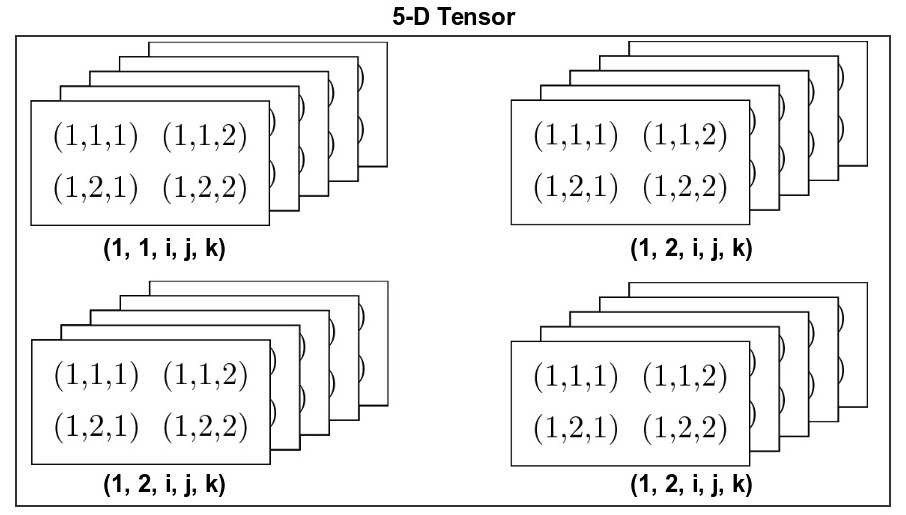
Now, try imagining a 6-D tensor.
A Simple TensorFlow program
"""
    In this block of code we perform the building of the DataFlow graph to
    implement a simple TensorFlow application the performs addition, sqrt,
    and the power operations.
"""

# Import the tensorflow library
import tensorflow as tf

# Need to reset the default graph to make sure that graph components from
# previous executions in the same notebook are not present in the graph.
tf.reset_default_graph() # Ignore this at first read.

# Simple operations with 0-D tensors (scalars)

# The constants are given float32 data type to confirm with definition of sqrt
ip1_op = tf.constant(3, name='input1', dtype=tf.float32) # op to hold data 3
ip2_op = tf.constant(5, name='input2', dtype=tf.float32) # op to hold data 5

add_op = tf.add(ip1_op, ip2_op, name="add") # Addition op

# The following is also correct, here TF automatically creates the constant op
# necessary to hold "3" and "5" in the TF graph.
# add_op = tf_add(3, 5, name="add")

sqrt_op = tf.sqrt(ip2_op, name="sqrt") # Takes sqrt of the input2 op

# Exponentiates the value of the add op with the value of the sqrt op.
pow_op = tf.pow(add_op, sqrt_op, name='pow')

# Ignore on First Read
g = tf.get_default_graph() # Get the graph as as an object for Tensorboard
# Make sure that the writer is created only after building the complete graph.
writer = tf.summary.FileWriter('graph', graph=g) # Ignore on first read

""" Evaluate the different nodes in the graph """
# Sessions are responsible for executing a graph (or parts of it) on the
# various computational resources available (CPUs, GPUs, TPUs etc.).
with tf.Session() as sess:
    output = sess.run([add_op, sqrt_op, pow_op])
    print(output)

writer.close()
[Out]
[8.0, 2.236068, 104.56122]
Tensorboard Graph Visualization
Tensorboard is a graph visualization (and so much more) tool provided along with the TensorFlow framework. The FileWriter API provided by TF writes the dataflow graph as a file so that Tensorboard can generate the visualizations.
Conclusion
TensorFlow is a numerical computation library built using the DataFlow paradigm, where the data that flows between the operations are tensors. In TensorFlow, a learning algorithm is represented as a dataflow graph, and the input data as tensors that flow through this graph. This is why the framework is aptly named TensorFlow. The following image is an animation that depicts the flow of input tensors through the dataflow graph. It also showcases how parallelism comes as an inbuilt feature with the DataFlow paradigm.
|
| Credit: Tensorflow Programmers Guide, Graphs and Sessions |
Due to the graphical nature of representing a TF application, we get the ability to combine operations in myriads of ways, giving researchers the flexibility needed to implement novel ideas. TF also leverages the inbuilt parallelism given by the DataFlow graph to provide efficient computational capabilities. Moreover, the clear separation between definition and computation, allows us to easily enable distributed computing for a TF application, making TensorFlow an ideal framework for enterprise ML/DL applications.

